Tools of the Neurophysiologist – Spectral Analysis and Bandpass Filters
(Joe’s notes: This guest post is written by Tom Epplin-Zapf on a topic that might be considered one of the field’s Achilles heel (or at least complaints from people after taking the CNIM has me to believe it as such). We are neuroelectrophysiologist in the operating room, but in my opinion, the “electro” part of that title should really deserve some additional study (myself included). It will make you a better clinician and help ensure the safety of the patient you’re about to zap with some electric current. Tom has done a great job of delivering these concepts in a way all of us can benefit from. There are moments where he could let his mathematics left brain unload a little on us, but does a nice job of restraint and even helps those right brainers out there by adding awesome pictures that help tell the story.)
As an intraoperative neurophysiologist, you occupy a unique space between the worlds of neurology and electrical engineering. In order to provide the highest-quality diagnostics for your patients and health care partners, you are taxed not only with keeping your knowledge base in neuroanatomy and physiology broad and current; you are also responsible for maintaining and manipulating electrodes, amplifiers, digital signal processors, and the software and algorithms used for sensing and actuating. Because your days are spent facing patients and contributing to the making and execution of clinical decisions, it’s understandable that education in the world of IONM often focuses first on the more medicine-adjacent fields. However, as neurophysiologic instrumentation becomes more sophisticated and its applications broaden, literacy in the mathematical algorithms underlying our tools becomes more essential. Let’s, therefore, take a moment to pay tribute to one of the most-invoked tools in the modern electrophysiologic arsenal: frequency domain analysis and the Fourier transform.
BACKGROUND – THE FOURIER TRANSFORM
A periodic function is one that is constructed by infinite repetition. Take, for example, the following sinusoid:
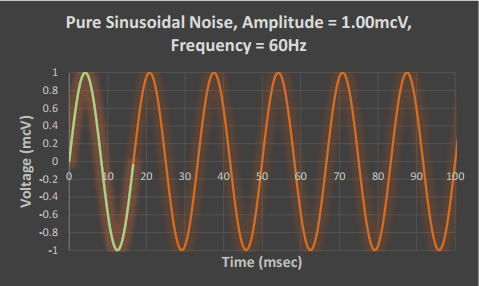
The green trace represents one period of the sinusoid. By repeating this trace continuously in either direction, the infinite sinusoidal function (orange) is achieved. This function has an amplitude (height from its average value) of A = 1.00mcV, a period (time duration of the repeated component) of T = 100msec / 6 periods = 16.67msec, and a frequency (number of periods that complete within one second) of f = 1 / T = 1 / 0.01667sec = 60Hz.
Sinusoidal waves are nice because most of their behavior is easily describable by just an amplitude and frequency. This simplicity makes them the basic building blocks of signal science, but also somewhat boring. A single sinusoid reflects one long note on a keyboard; but what if we wish to describe a song? Songs (good songs, anyways) have varied and complex melodies and rhythms, and usually make use of the whole instrument, not just one key.
The early 19th-century French mathematician and physicist Joseph Fourier supplied the world of signals mathematics with a means to bridge the gap from simple sinusoids (single notes) to complex, aperiodic functions (songs): the Fourier Transform.
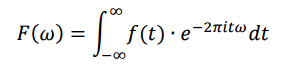
Let’s avoiding rupturing our aneurysms with math and unpack the general meaning of Fourier’s result instead. The Fourier Transform provides us a way to “decompose” a complicated, time-based signal f(t) into a description F(ω) of the sinusoids that make up the signal. It’s also a reversible process: by combining all of the sinusoids described by the frequency-domain function F(ω), we can “reconstitute” a signal in the time-domain (Inverse Fourier Transform).
Examining some signals in both the time-domain and the frequency-domain can help to develop some intuition about how we might put the Fourier Transform to use. Let’s take a look again at our 60Hz, 1.00mcV sinusoid and its frequency spectrum under Fourier Transformation:
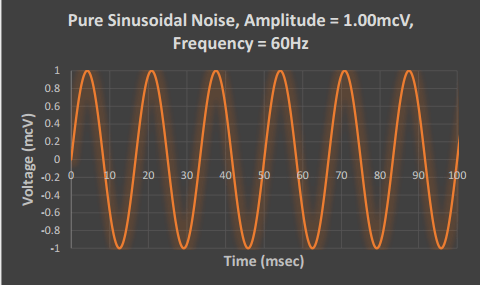
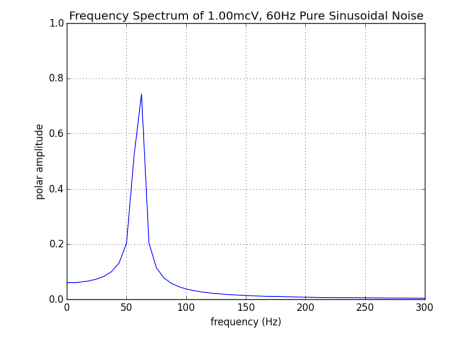
The time-domain representation of the 60Hz sinusoid (first image) should be familiar (and unwelcome) to any IONM professional who has encountered electrically-“leaky” O.R. equipment. The frequency-domain representation of the same sinusoid (second image) is obtained by performing a Fourier Transform on the signal of the first image. Notice that the frequency spectrum consists, essentially, of a single peak at 60Hz.
Compare these figures to those of a sinusoid with twice the frequency, f = 120Hz:
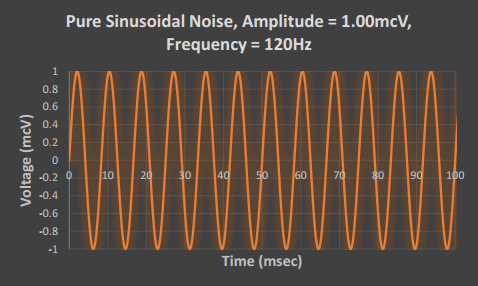
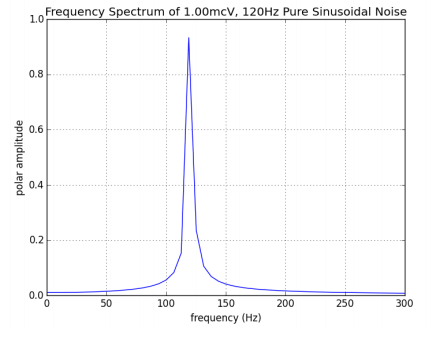
Notice how doubling the frequency of the signal has affected its presentation in both the time- and frequency-domains. In the time-domain, twelve periods of the sinusoid now complete in 100msec, while in the frequency-domain, the peak of the signal’s Fourier Transform has moved from 60Hz to 120Hz.
Modifying the amplitude of the original sinusoid also produces an observable effect in the frequency-domain:
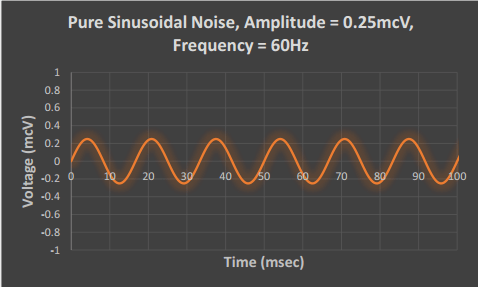
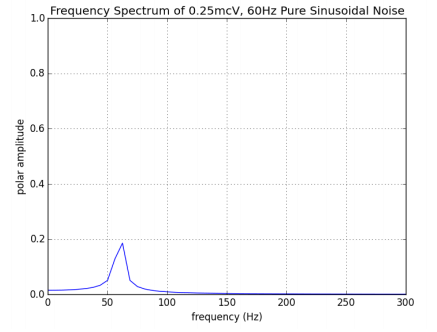
By reducing the amplitude of the time-domain sinusoid to a quarter of its original voltage, the amplitude of the peak in the frequency spectrum also reduces to a quarter of its original height. By modifying the power of any sinusoidal component in the time-domain, the height of the frequency-domain point corresponding to the sinusoid’s frequency changes proportionately.
These Fourier Transform pairs of simple sinusoids and isolated peaks are well-behaved studies for demonstration. Suppose, though, that we are interested in a time-domain waveform with a more complicated behavior than a pure sine wave.
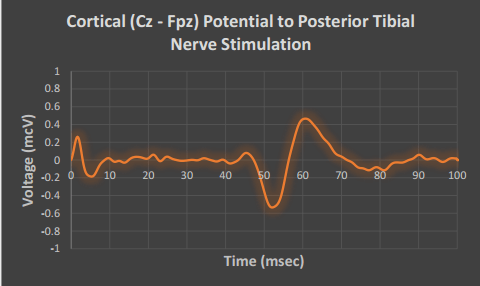
Here we have a multi-phasic cortical potential produced by stimulating a posterior tibial nerve (PTN) and recording from the referential montage Cz – Fpz. This signal is anything but periodic; we would be hard-pressed to find a single sequence of points that repeats anywhere in this potential. Nevertheless, according to Joseph Fourier, the right combination of sinusoids with specific amplitudes and frequencies may be added together to produce this potential. As previously seen, that combination is produced by applying the Fourier Transform to this time-domain signal:
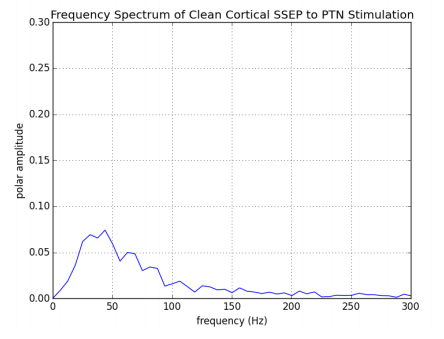
Notice how this frequency spectrum differs from those of the simple sinusoids studied previously. Instead of a single dominant peak, the Fourier spectrum of the PTN SSEP consists of a broad range of frequencies mostly spanning 0 – 125Hz. This should match intuition: the SSEP is composed of a stimulus artifact from 0msec to 9msec, a cortical component from 45msec to 67msec, and an approximately null signal everywhere else. If we model the two non-zero components of the signal as single sine wave periods, they would have frequencies:
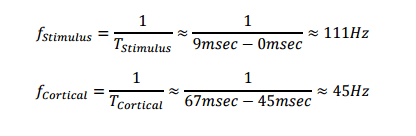
Because the cortical component of the SSEP has much more power (voltage and duration) than the stimulus artifact, it makes sense that the highest-power components of the Fourier spectrum are those around 45Hz and that the magnitude of the Fourier spectrum trails off at higher frequencies.
BANDPASS FILTERING – APPLICATION OF FREQUENCY-DOMAIN ANALYSIS
Having cultivated an intuitive sense of the translation between time and frequency domains afforded to us by the Fourier Transform, how now do we derive some practical use from it? In particular, can we harness the power of frequency-domain analysis to help us tackle the situation of noisy electrical contamination in our daily IONM work? The following is probably a variation on a familiar struggle:
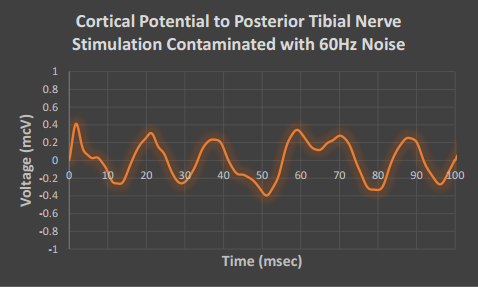
Clinically useless! While a murky cortical potential may be “peeking through” starting at approximately 50msec, it is so indistinguishable from the surrounding noise (its signal-to-noise ratio is so low) that no meaningful clinical decision-making should be made from it. Applying the Fourier transform to this potential:
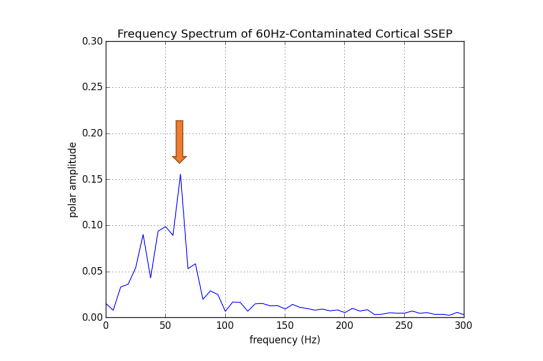
Notice that this Fourier spectrum is very comparable to that of the “clean” cortical SSEP studied previously except for the addition of a new prominent peak at 60Hz. Already Fourier analysis has demonstrated its use by helping us to quickly identify the frequency at which the contaminating noise lives! Now, if we had some way of removing the 60Hz peak from the Fourier spectrum while preserving the frequencies corresponding to the cortical component of the SSEP, we could use the reversibility of the Fourier process to reconstruct the SSEP sans-60Hz-noise.
The Low-Pass Filter
Fortunately, such a method exists. Consider the time-domain function known as the Sinc-Hanning low-pass filter (so named because it is the product of a normalized trigonometric sinc function and a Hanning window function):
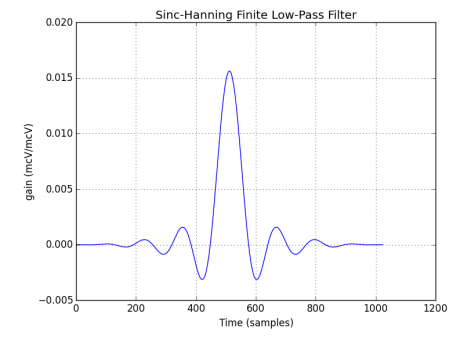
While this function might not look like much in the time domain, its frequency spectrum under Fourier Transform reveals its utility:
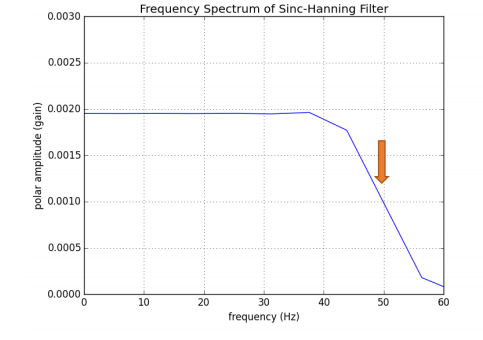
A low-pass filter is one that allows slower frequencies below a given cutoff frequency to remain while nullifying the frequencies above the cutoff frequency. In the case of the above Sinc-Hanning Filter, the cutoff frequency was chosen as . The filter rolls off from unity (leaving the lower-frequency components unchanged) to zero (nullifying the higher-frequency components) between 40Hz and 60Hz (centered at the cutoff frequency, 50Hz). When the frequency spectrum of the Sinc-Hanning Filter is multiplied pointwise by the frequency spectrum of the contaminated SSEP:
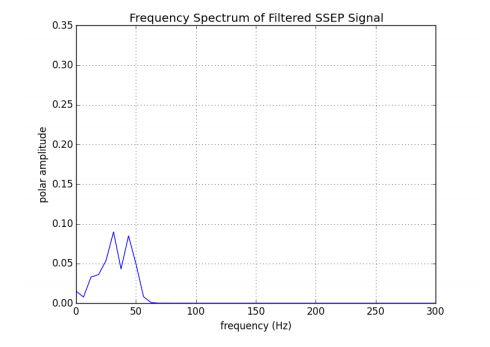
All of the frequency components of the contaminated SSEP at and above the 50Hz cutoff frequency have been reduced. It’s important to note here the collateral damage: while the 60Hz peak corresponding to the noisy contaminant has been effectively treated by low-pass filtering, the filter also has affected the components of the cortical SSEP that exist around and above the cutoff frequency.
Fortunately for us, we know from our previous study that the “significant” part of the cortical SSEP that we’re interested in lives a bit below the filter’s 50Hz cutoff frequency. We can expect that application of the chosen filter will yield some distortion of the SSEP, but accept this as a necessary evil for the treatment of the daunting 60Hz noise to yield a reliable metric. Applying the Inverse Fourier Transform (the process that, as its name implies, is used to reconstruct a time-domain signal from a Fourier frequency spectrum) to the filtered SSEP frequency spectrum yields the following treated SSEP signal in the time-domain:
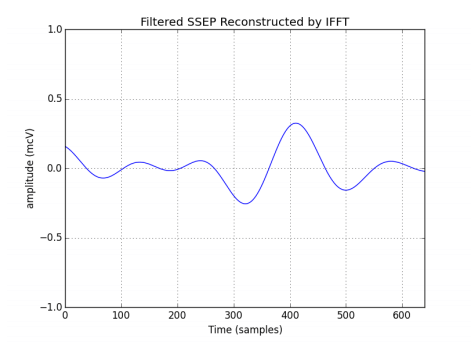
A much prettier picture than the noisy potential with which we started! And certainly, an SSEP that can be deemed reliable based on signal-to-noise measurements. As expected, the 60Hz noise is now completely absent. Coincidentally, we’ve also almost completely lost the stimulus artifact from the first 10msec of the trace; recall that we previously estimated the stimulus artifact to live around a frequency of 111Hz, well above the filter’s cutoff frequency.
It’s notable that, while the characteristic potential of the cortical SSEP to PTN stimulation has become much clearer, its amplitude measure has changed (from 1.03 mcV to 0.59 mcV). This represents a significant reduction and the result of the aforementioned distortion. While spectral analysis and the application of band-passing filters provide powerful tools for the identification and treatment of noisy elements in IONM signals, they should be used with an eye for their encroachment on signal components of interests. If more conservative techniques like hardware management and signal averaging yield similar results to spectral analysis and filtering, they are often preferable for their minimal collateral impact.
(Joe’s notes: Just as Tom implies in this last paragraph, we should look to make changes in these filter settings as a secondary/last resort. When we create a test or program, we should select filter settings that are appropriate for the signals that we are trying to collect. But because these filters will not only affect unwanted artifact but also our physiological response, we need to be very judicious in our modifications of filters.
But that doesn’t mean that we shouldn’t keep this in our troubleshooting arsenal. From what I’ve seen in the field, this warning against changing filters has morphed into the warning of “don’t do it.” That’s unfortunate, because, in the hands of someone that understands the concepts and the application, this is just one more tool to use. It could be the difference of mistakenly placing blame on a
If you take Tom’s example and make a more extreme delay in onset latency, reluctance to adapt filter settings could be the difference of mistakenly placing blame on a loss of nerve conduction speed and temporal dispersion when the root cause of the poor amplitude could be due to filtering of an unusually late onset wave. Would opening your bandpass improve the signal you’re looking to collect, or would it allow for too much unwanted noise? Probably a question worth answering prior to incision.)

Tom Epplin-Zapf
Clinical Development Manager - Sentient Medical Systems
Want new articles before they get published?
Subscribe to our Awesome Newsletter.
Keep Learning
Here are some related guides and posts that you might enjoy next.
How To Have Deep Dive Neuromonitoring Conversations That Pays Off…
How To Have A Neuromonitoring Discussion One of the reasons for starting this website was to make sure I was part of the neuromonitoring conversation. It was a decision I made early in my career... and I'm glad I did. Hearing the different perspectives and experiences...

Surgical Neurophysiologist Salary: Who Are The High Earners? Part 2
In Response To High Earning Surgical Neurophysiologist Being The Best At Sales [Joe's notes: This is a guest post - or really a response to my previous post - that was insightful and, well, long enough to turn it into its own blog post instead of a comment. Full...

Surgical Neurophysiologist Salary: Who Are The High Earners?
Surgical Neurophysiologist Jobs That Pay Looking back over the past decade of money being paid to a neuromonitoring technologist, there's been some waxing in waning in the surgical neurophysiologist salary category as to who deserves the higher salary. 10+ years ago,...

Intraoperative EMG: Referential or Bipolar?
Recording Electrodes For EMG in the Operating Room: Referential or Bipolar? If your IONM manager walked into the OR in the middle of your case, took a look at your intraoperative EMG traces and started questioning your setup, could you defend yourself? I try to do...
BAER During MVD Surgery: A New Protocol?
BAER (Brainstem Auditory Evoked Potentials) During Microvascular Decompression Surgery You might remember when I was complaining about using ABR in the operating room and how to adjust the click polarity to help obtain a more reliable BAER. But my first gripe, having...
Bye-Bye Neuromonitoring Forum
Goodbye To The Neuromonitoring Forum One area of the website that I thought had the most potential to be an asset for the IONM community was the neuromonitoring forum. But it has been several months now and it is still a complete ghost town. I'm honestly not too...

0 Comments